![]() Species |
Rice |
Maize |
Wheat |
Barley |
Oats |
Foxtail Millet |
Pearl Millet |
Rye |
Sorghum |
Wild Rice |
Brachypodium |
Oryza Species |
Grape |
Arabidopsis
Species |
Rice |
Maize |
Wheat |
Barley |
Oats |
Foxtail Millet |
Pearl Millet |
Rye |
Sorghum |
Wild Rice |
Brachypodium |
Oryza Species |
Grape |
Arabidopsis
Figure 1*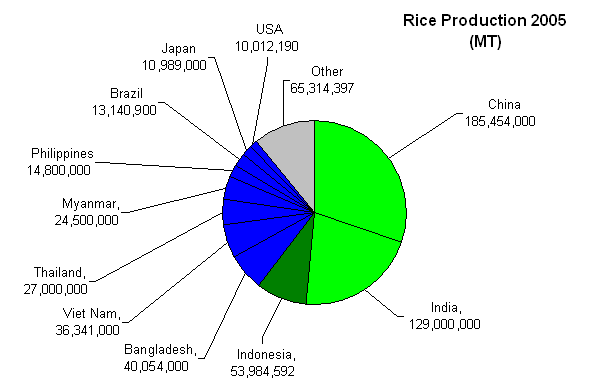 | Figure 2*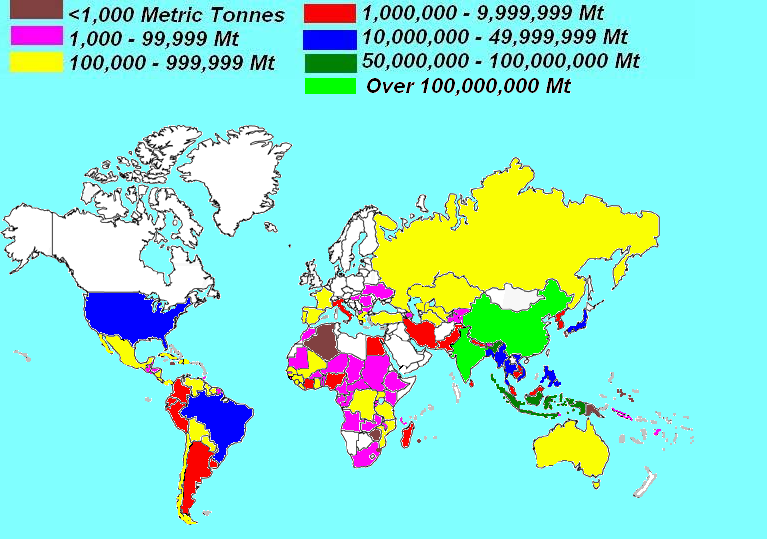 |
| The graph above shows the production of rice for 2005. The top 11 countries together produce 545,275,682 of the total world production of 617,941,079 Mt (based on FAOSTAT, 2005. Crops Primary data last updated July 14, 2005, Food Supply Data last updated Aug 27, 2004.) The top two producing countries produced more than the other 9 together. The map in Figure 2* shows 2005 rice production in Mt across the world. |
")
")
")
")
")
")
")
")

")


